

%20(1).svg)

.webp)
.svg)


Looking for Senior AWS Serverless Architects & Engineers?
Let's TalkBuilding high performance serverless applications can be tough, but a service like AWS X-Ray will help you understand your AWS Lambda application code better, slow DynamoDB queries or HTTPS requests, and then track how your changes improve over time.
AWS X-Ray is a service that collects data from all the requests handled by your services, allowing you to visualize and analyze it. It generates service maps, response time or duration distribution, and segment timelines to help developers debug performance issues and improve the overall performance of their code. Setting up X-Ray is straightforward and only requires a few simple steps, including enabling tracing and configuring what X-Ray should capture.
Introduction
Observability and code profiling is, at least in most cases, an afterthought that comes into play once it’s too late. Most developers start thinking about it when they face issues, timeouts, or bottlenecks that they can’t easily resolve or justify with only the execution logs.
There are a lot of third-party observability and profiling third-party tools out there that might be useful, for example, Sentry.io, Dynatrace, or DataDog. But if you want to stay inside the AWS ecosystem, and have an almost effortless integration, AWS X-Ray would be the tool to choose.
In this article, we will go over what AWS X-Ray is, how we can enable it, and how it will help us to better understand and debug the performance of our code.
What is AWS X-Ray?
As per AWS's words, “AWS X-Ray is a service that collects data from all the requests handled by your services and allows you to visualize and analyze it.” In other words, AWS X-Ray is for requests and services interaction what Cloudwatch is for execution logs.
When enabled and correctly configured, AWS X-Ray will collect and measure all service interactions for a specific request. This information will be stored and made available for analysis in the following ways:
1. Service Maps
AWS X-Ray generates service maps to allow for a visual understanding of how all different services interact with each other. Using a somewhat simple CRUD orders API as an example; we’d be able to see the following two service maps:
Global Service Map:
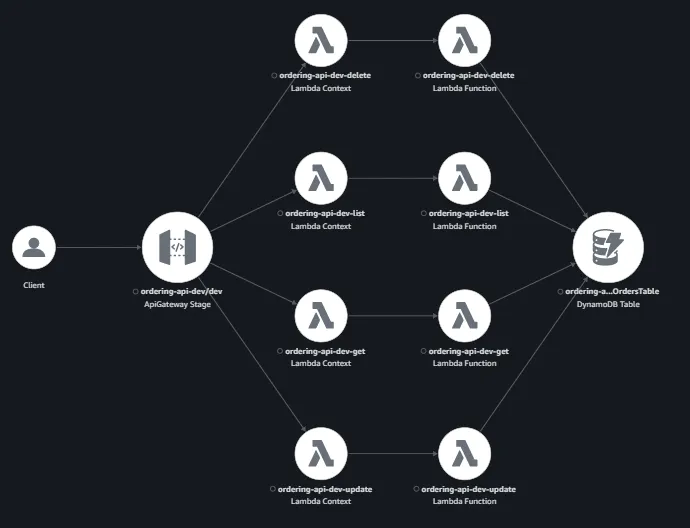
This type of service map will allow the user to understand and visualize how all the services under the same domain interact. In this screenshot, we can see that the end-client interacts with a single API Gateway which, depending on the request type, depends on a set of Lambda functions to process the request and interact with a single DynamoDB table.
Trace Service Map:
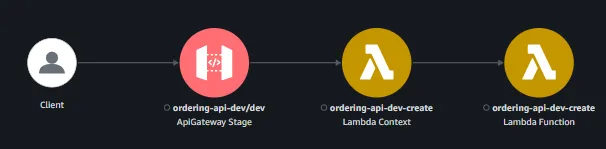
The second kind of service map can be found on the console when reviewing a single trace and will contain only the interactions with services for that single trace or user request. This is the one that will help us the most when trying to debug performance issues for different features since we’ll be able to see what services are being used and how the different executions took place.
For example, in the provided screenshot we’re able to see that the execution failed since the nodes displayed for both API Gateway and AWS Lambda are in an error state.
2. Response Time or Duration Distribution
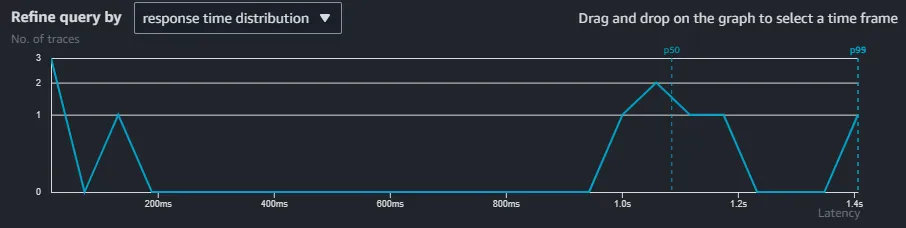
AWS X-Ray also provides a distribution diagram for groups of traces. This is specifically useful when trying to understand the overall performance of your service, how it affects the end users, and how much effort should be put into improving the service for each scenario.
For example, performance issues should be prioritized differently if it affects only 0.5% of all requests or if it affects 50% of them.
3. Segment Timelines
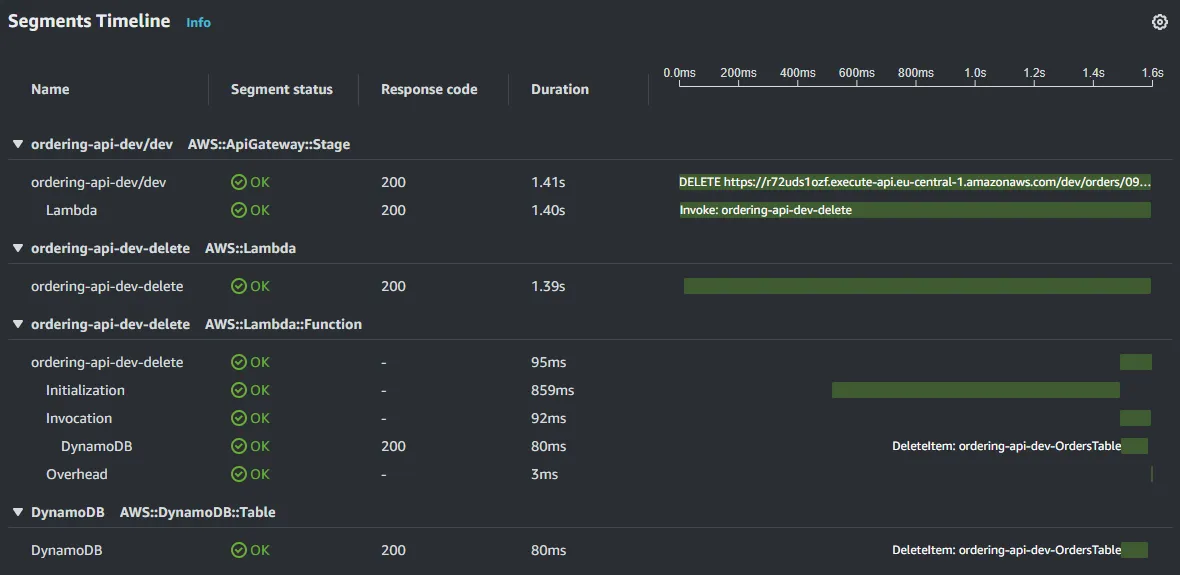
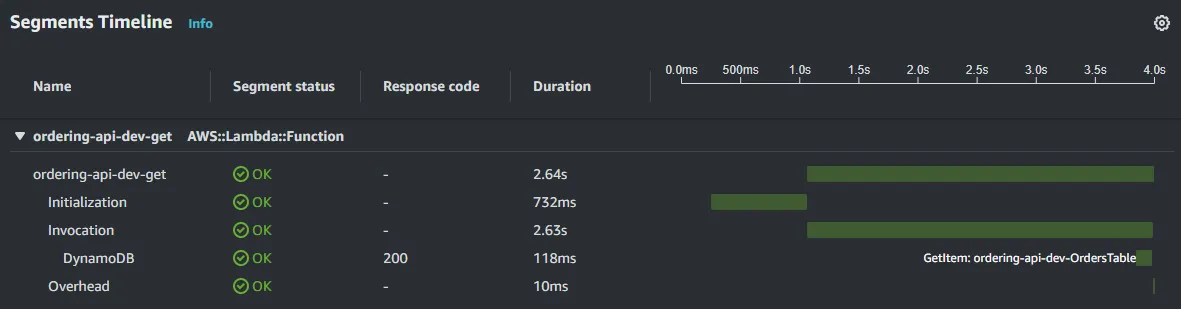
Segment timelines are the most detailed diagrams that X-Ray will provide and allow developers to understand exactly how and when each service is being used.
These timelines are specifically useful when debugging performance issues. For example, in this provided example we can see that the culprit for the long execution time is the Lambda Initialization (a.k.a. Cold Start) which took 859ms to complete, and that most of the execution time for the AWS Lambda invocation itself was spent requesting the deletion of the item in DynamoDB.
Enable AWS X-Ray in AWS Lambda
Enabling AWS X-Ray on your AWS Lambda functions is very straightforward, and can normally be accomplished within a few minutes following two simple steps.
Step 1: Enable AWS X-Ray tracing on Your Services
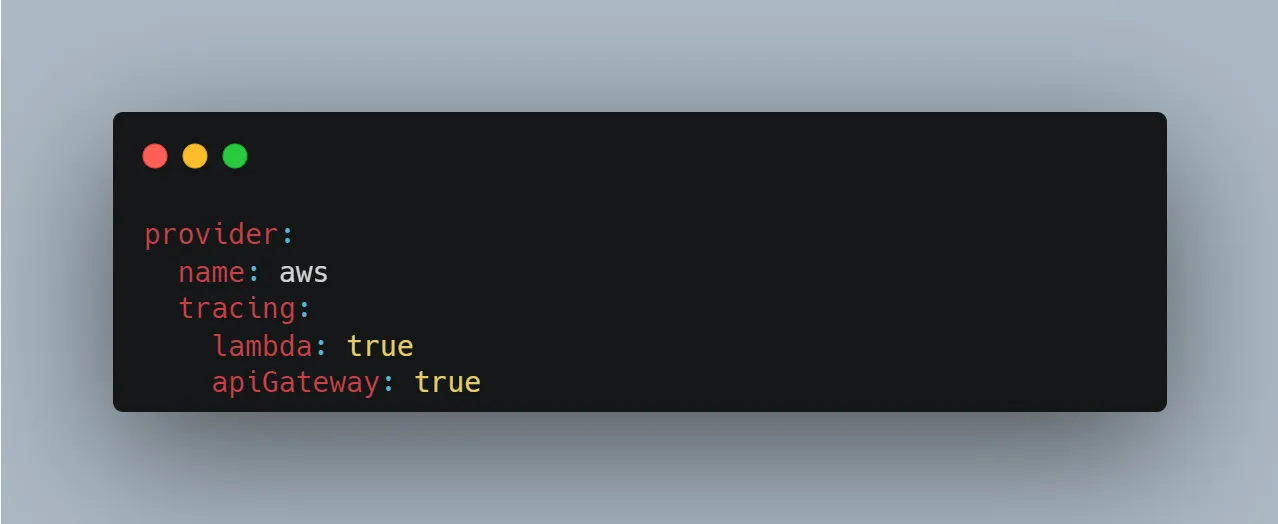
The easiest way to do so is to enable it from your IaC template. For example, when using Serverless Framework, you can just add the following attributes under 'provider.tracing' to enable AWS X-Ray on all your defined AWS Lambda functions and the generated API Gateway.
Another option, in case you’re not deploying your services with an IaC template, would be to enable it manually through the AWS Console.
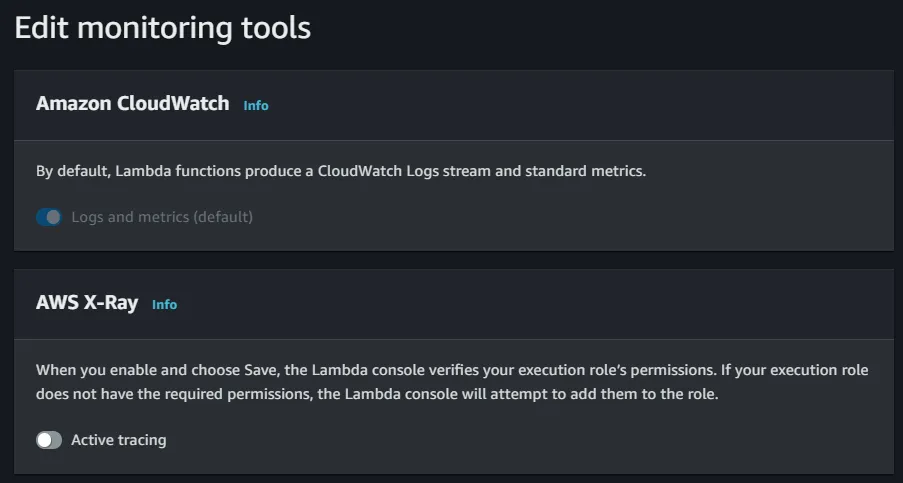
You will just need to head over to your Lambda configuration section and Edit the 'Monitoring tools' section by enabling the tracing switch.
Step 2: Configure What X-Ray Should Capture
After enabling AWS X-Ray on your Lambda function, you will also need to add the 'aws-xray-sdk-core' library to your project's dependencies and configure it to add the required traces.
Capturing AWS SDK Usage:
Wrapping the 'aws-sdk client' with the showcased functions will allow AWS X-Ray to capture and trace how the client is being used. For a Node JS project, there are two different configurations depending on the aws-sdk version your project is currently using.
If you are using aws-sdk v2, you'll only need to wrap the library once and it will have a “global” effect.
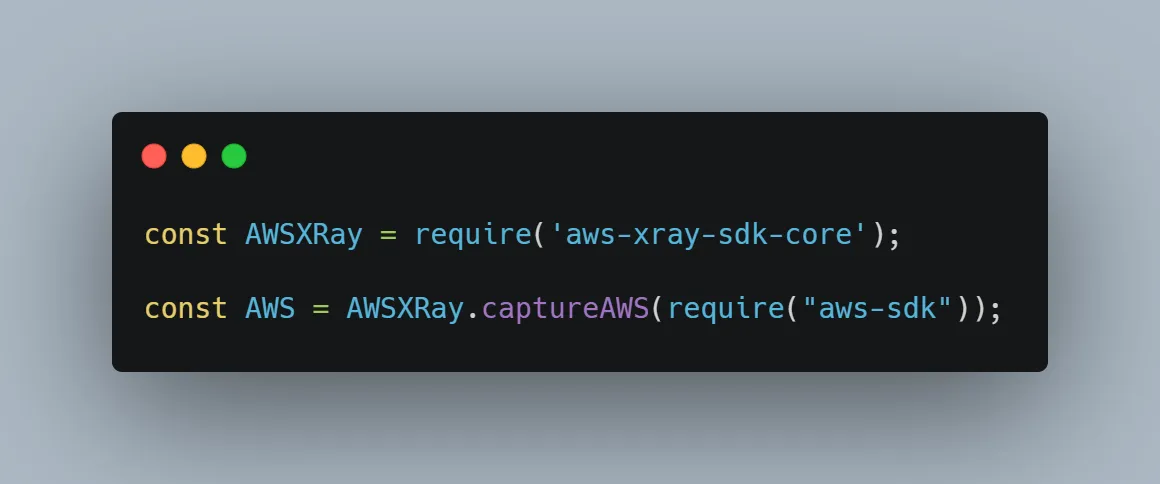
For example, with the provided code snippet, AWS X-Ray will be able to capture all requests done with the v2 SDK, independently of the client (SSM, DynamoDB, S3, etc).
When using the v3 SDK, the developer will need to add the AWS X-Ray wrapper to all the instantiated clients.
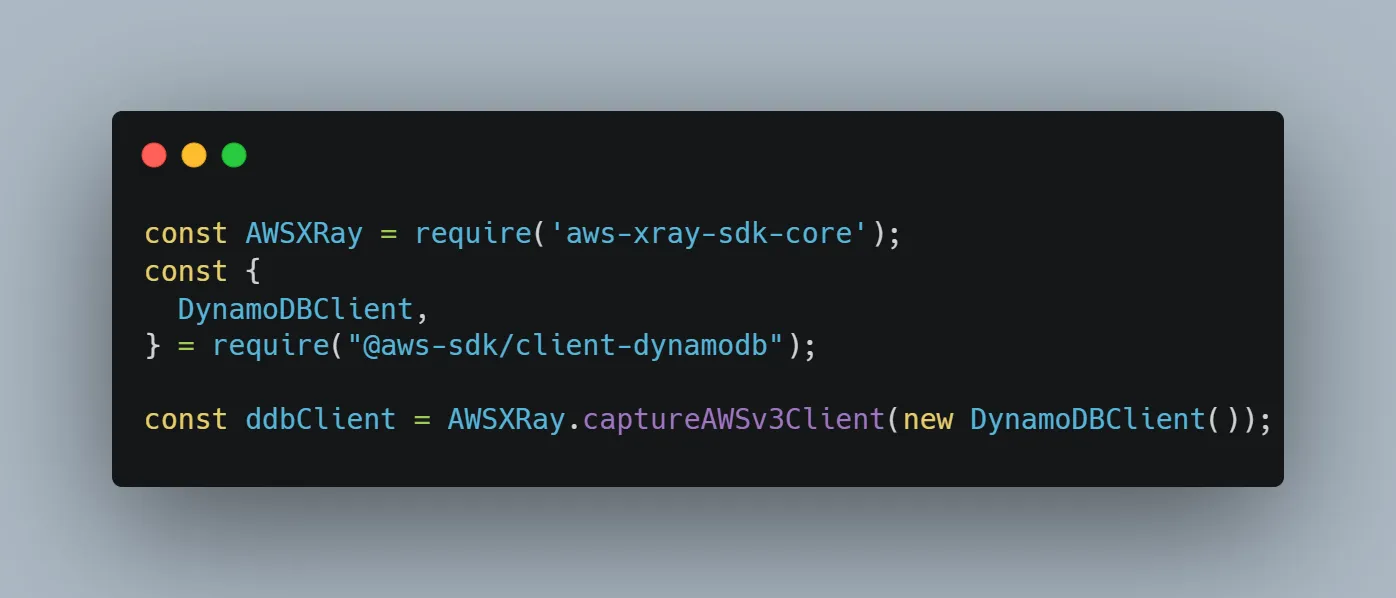
This snippet, for example, will allow AWS X-Ray to only capture the requests made with that specific DynamoDB client. If you instantiate another DynamoDB client (or for any other service) in another file without adding the wrapper, AWS X-Ray won’t be able to capture the usage.
Capturing HTTPS Requests:
In some cases, your project may also use some HTTPS requests to, for example, access third-party APIs which you’d also like to capture.
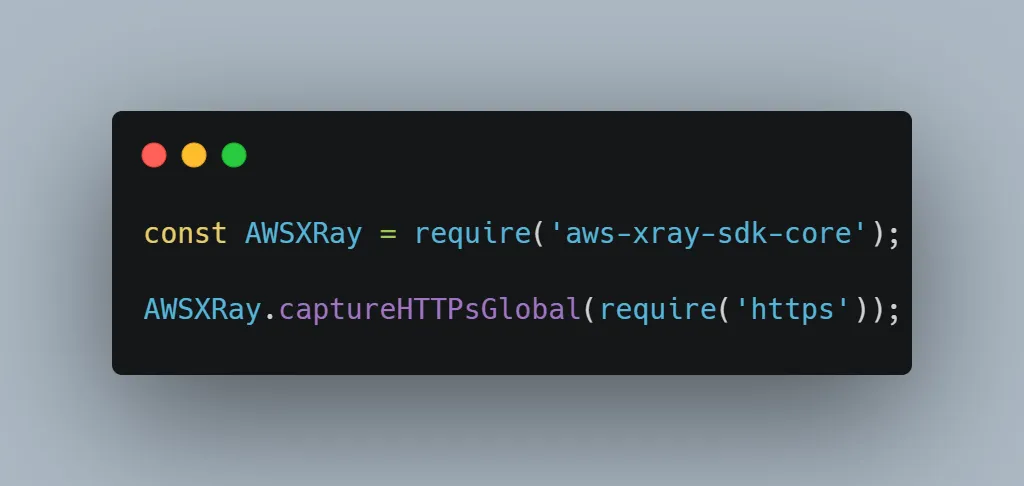
In order to do so, and similarly to wrapping the v2 SDK, you can add the above snippet to your index file to allow AWS X-Ray to capture all the HTTPS requests made by your code.
Adding Custom Subsegments:
Custom subsegments will allow AWS X-Ray to capture and measure the execution time of the desired part of your code.
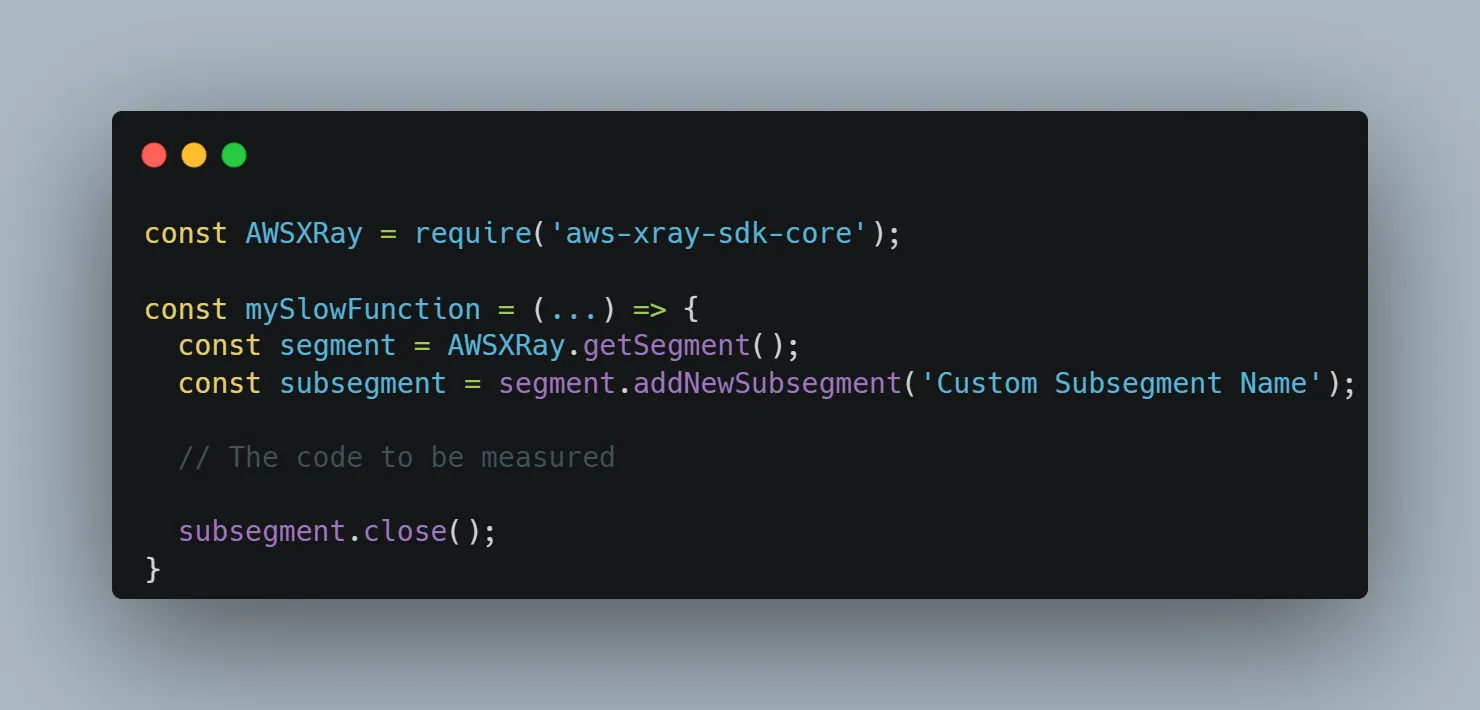
One may add a custom segment by following the provided code snippet, where AWS X-Ray will measure the execution time of the code written between the 'segment.addNewSubsegment(…)' and 'subsegment.close()' functions. The custom subsegments will be displayed in the AWS X-Ray console under the Segment Timelines diagram.
How Can AWS X-Ray Help You Find Performance Bottlenecks?
Now that we know what AWS X-Ray has to offer and how to set it up, most of you will already have guessed how it can be a very useful tool but here are my favorite ways to take advantage of it:
Discovering Critical Services Under the Same Domain
AWS X-Ray provides (and builds based on the selected traces) a visual map of all the services linked to a specified domain.
In the example used above, we can see that this domain is composed of one API Gateway, four AWS Lambdas, and a single DynamoDB table.
Apart from seeing all the services linked to a domain, AWS X-Ray will also visually display the percentage of error executions that nodes might have.
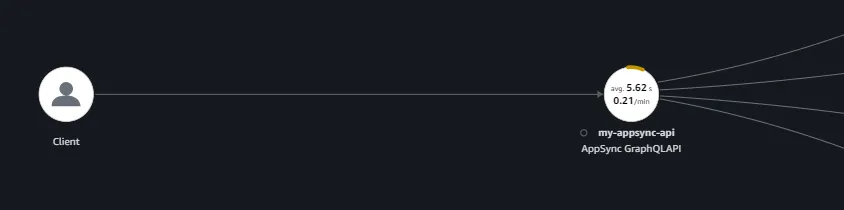
In this provided example, we can easily see that the AppSync GraphQL API has an average error rate of around 10%.
From this example, we could see that the bottlenecks for the execution of this Lambda where:
Identifying the Performance Bottlenecks
Once the developer has found the nodes to be analyzed, the next step would be taking a look at the different traces for that node to better understand where it’s spending most of the execution time.
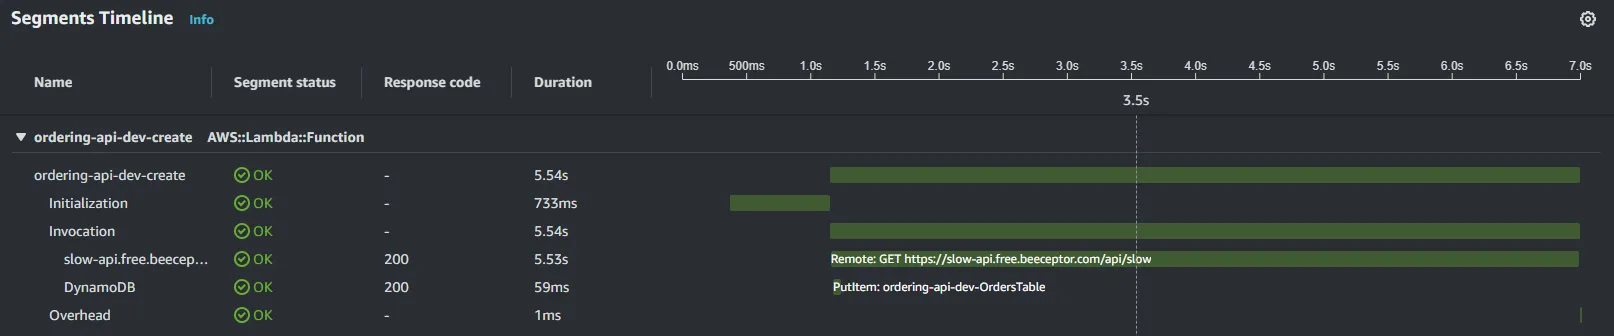
For this task, one could take advantage of the Segment Timelines. These timelines will visually display how long each action took to be executed.
From this example, we could see that the bottlenecks for the execution of this Lambda were:
- The cold start, which added 733ms to the execution time.
- The API request, which took 5.53s of the actual invocation time of the lambda.
After seeing these results, a developer would know that he would need to work possibly on avoiding cold starts and on improving (if owned) the API that is called during the execution.
Using Custom Subsegments to Profile & Improve Your Code
At last, one of the best-kept secrets of AWS X-Ray, using custom subsegments to profile your code and have a better understanding of where the time is spent during an execution.
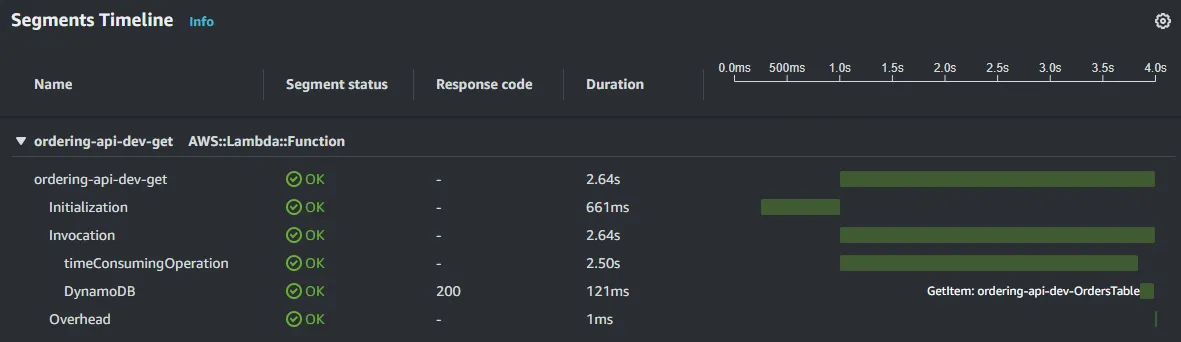
Given this Segment Timeline, we would know that the execution is taking longer than it should since we expected the DynamoDB request to be the only time-consuming operation. Without the above traces, we wouldn’t be able to understand what is taking so long.
At this point, a developer would have two options:
- Spend hours reviewing the code and blindly updating it to try to find the time-consuming task.
- Add custom subsegments to the operations we suspect could be the culprit of the high execution time.
After adding a custom subsegment to the suspected function, we would be able to see a trace like this:
Here we can clearly see that the 'timeConsumingOperation' function is responsible for the extra 2.5 seconds of execution time. Thanks to this insight, the developer would know that they only need to focus on reviewing and improving that specific operation.
Conclusion
We highly recommend correctly setting-up AWS X-Ray when developing services on AWS, especially if they are serverless, in order to allow for better observability and profiling. As showcased in this article, AWS X-Ray will allow developers to better understand how a service is performing and speed up the process of debugging performance bottlenecks or timeouts once the service is deployed to production.
Did you find this article interesting or useful? Do you have any questions or would like to chat more about it? I’d love to connect with you on my social media, you can find me on LinkedIn or Twitter.
References